- A good ROAS is any ROAS above your break-even ROAS, and break-even ROAS is 1 divided by your contribution margin.
- Platform ROAS counts sales by the platform's own rules, so Meta, Google and Shopify will disagree; manage the business on blended MER from Shopify revenue.
- A ROAS below break-even can be fine for new-customer campaigns, if your repeat-purchase data shows customers pay back the difference.
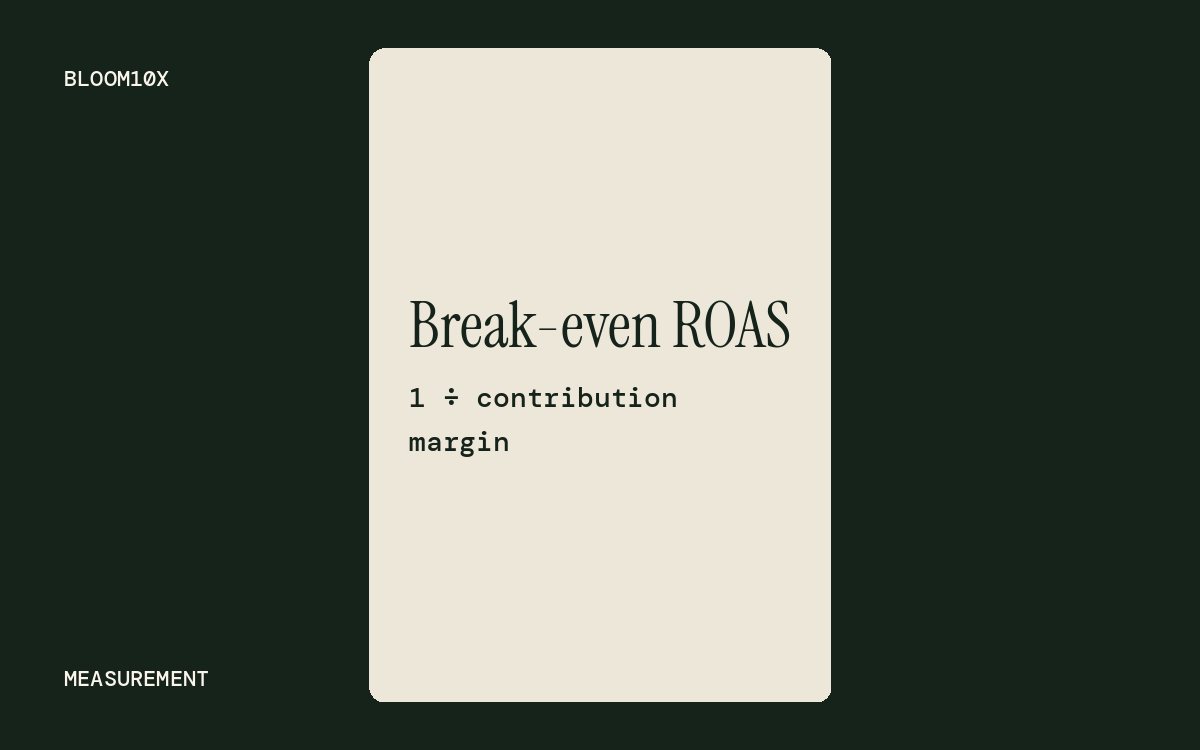
A good ROAS is any ROAS above your break-even ROAS, and break-even ROAS is 1 divided by your contribution margin. A brand that keeps 40% of each sale after product, shipping, fees and discounts breaks even at 2.5, so a 3.0 ROAS makes money for that brand and loses money for a brand that keeps 25%. This article covers the ROAS formula, how to calculate break-even and target ROAS with a worked example, why Meta's ROAS never matches Shopify, why blended MER matters more, and when a low ROAS is the right call.
What is the ROAS formula?
ROAS = revenue from ads / ad spend
Spend $1,000 and get $4,000 in attributed sales, and your ROAS is 4.0. Some tools show the same thing as a percentage. Google Ads' help page on Target ROAS uses the example of $5 in sales on $1 of spend as a 500% ROAS. A 4.0 and a 400% are the same number.
ROAS on its own tells you nothing about profit. A 4.0 on a product with a 20% margin loses money. A 2.0 on a product with a 60% margin makes money. That is why the useful question is what your break-even ROAS is.
How do you calculate break-even ROAS?
Break-even ROAS = 1 / contribution margin
Contribution margin is the share of each sale left after every cost that comes with an order: product cost, shipping, payment fees, discounts and returns. It leaves out ad spend, because that is what you are solving for. The contribution margin calculator works it out per order.
Shopify's break-even ROAS calculator uses 1 / gross margin. That works if gross margin is all you have, but it ignores shipping, fees and discounts, so it sets the bar too low. Shopify's 2026 ROAS benchmarks page describes break-even as the point where ad revenue covers product cost "plus shipping, discounts, payment fees, and the ad spend itself." Contribution margin gets you there.
Worked example: Demo Brand
Demo Brand is a made-up Shopify store with round numbers, used here as an example.
| Per order | Amount |
|---|---|
| Average order value | $100 |
| Product cost | $30 |
| Shipping and packaging | $10 |
| Payment fees | $3 |
| Discounts and returns | $7 |
| Contribution before ad spend | $50 (50%) |
Break-even ROAS = 1 / 0.50 = 2.0.
Check it. Demo Brand spends $10,000 on ads at a 2.0 ROAS and makes $20,000 in sales. Half of that, $10,000, is contribution. It pays exactly for the ads. Profit is zero.
At a 3.0 ROAS, the same $10,000 brings $30,000 in sales and $15,000 in contribution. After $10,000 in ads, Demo Brand keeps $5,000.
The ROAS calculator runs this for your own numbers: enter revenue and spend for ROAS, and your costs for break-even ROAS.
Break-even ROAS by margin
| Contribution margin | Break-even ROAS |
|---|---|
| 20% | 5.0 |
| 25% | 4.0 |
| 33% | 3.0 |
| 40% | 2.5 |
| 50% | 2.0 |
| 60% | 1.67 |
This table is the reason industry ROAS averages are close to useless. Two brands in the same category with different margins need very different ROAS to stay in profit.
What is the difference between break-even ROAS and target ROAS?
Break-even ROAS is the floor. Target ROAS is the ROAS that leaves the profit you want after ads.
Target ROAS = 1 / (contribution margin minus target profit margin)
Demo Brand wants 15% of revenue as profit after ad spend:
1 / (0.50 minus 0.15) = 1 / 0.35 = 2.86
Check it: on $100 of sales, $50 is contribution, $35 goes to ads, and $15 is left. $100 / $35 = 2.86.
This target is what you put into a bid strategy. Meta's ROAS goal bid strategy aims to keep return on ad spend near an average you set, and Google's Target ROAS does the same for Google campaigns. Set the goal from this math, not from a number you heard on a podcast.
Why doesn't platform ROAS match Shopify sales?
Because each platform counts sales by its own rules, and each one is allowed to count the same order.
- Meta credits a purchase to an ad if it happened within 1 or 7 days of a link click, within 1 day of someone seeing the ad, or within 1 day of a non-link click, depending on the attribution setting you choose, per Meta's page on attribution settings. A view-through sale counts even if the buyer never clicked.
- Shopify's marketing reports use last non-direct click by default, giving 100% of the credit to the last channel the customer came through before buying, per the Shopify Help Center.
- Google and your email platform each claim sales by their own windows too.
So one customer who saw a Meta ad, searched your brand on Google and bought from an abandoned cart email can show up as a sale in all three. Add up every platform's reported revenue and you will often get more than Shopify actually took in.
Meta says as much. Its attribution page warns that results from different attribution models should not be compared, and that "if using external analytics tools, evaluate performance in those tools." Meta also now offers an incremental attribution model that tries to count only conversions the ad caused. That is a better input, and still the platform grading its own work.
Why does blended ROAS (MER) matter more?
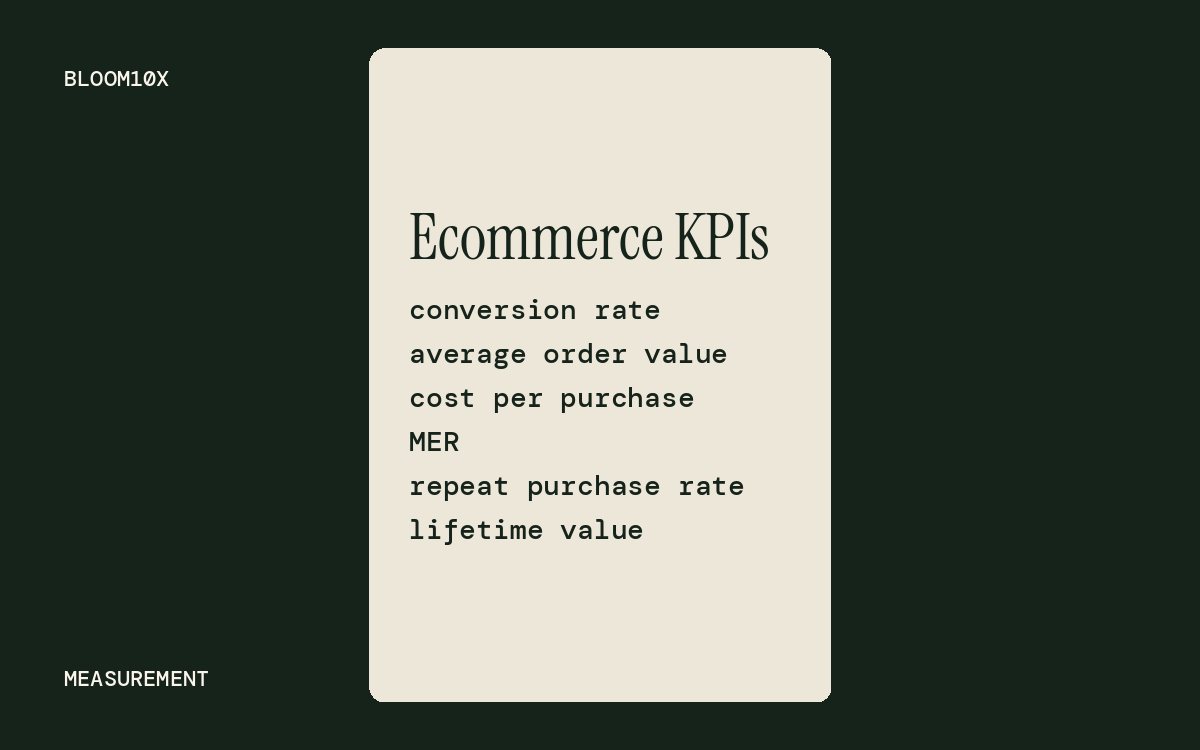
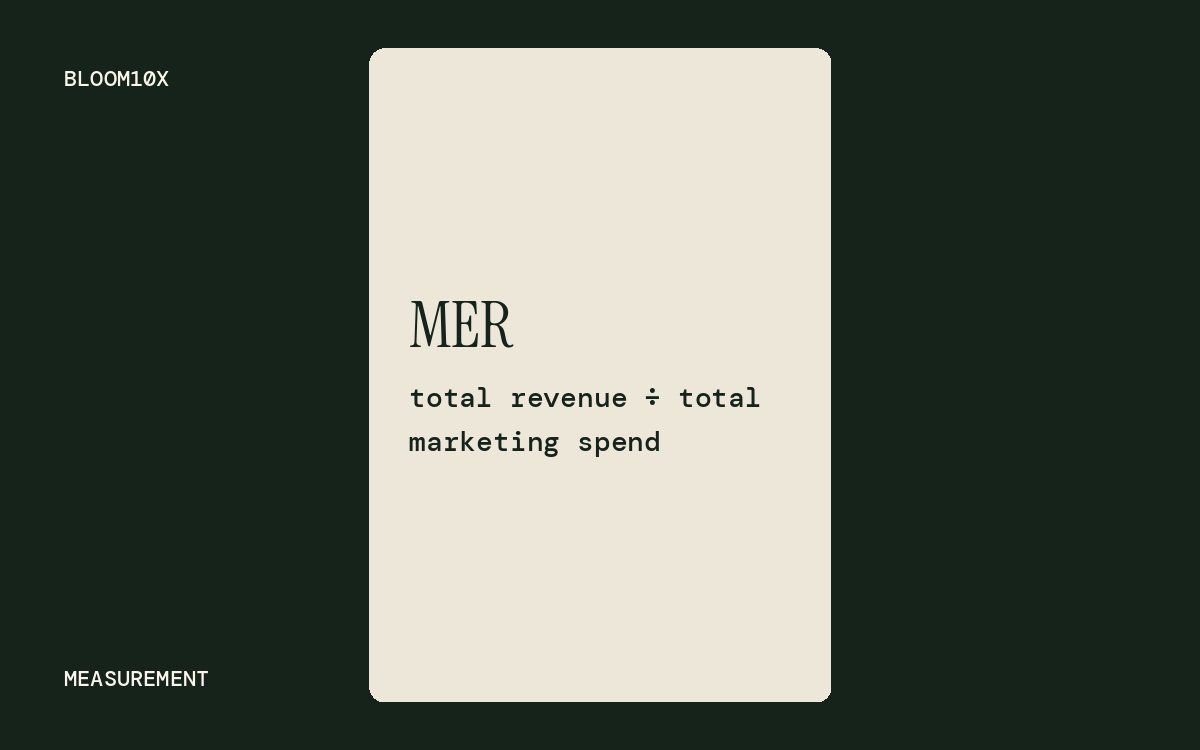
MER, or marketing efficiency ratio, is total Shopify revenue divided by total marketing spend across every channel. No platform can inflate it, because neither number comes from a platform.
Demo Brand, one month:
| Source | Spend | Revenue claimed |
|---|---|---|
| Meta | $25,000 | $100,000 (ROAS 4.0) |
| $15,000 | $75,000 (ROAS 5.0) | |
| Platforms combined | $40,000 | $175,000 |
| Shopify actual | $40,000 | $120,000 (MER 3.0) |
The platforms claim $55,000 more than the store sold. The MER of 3.0 is the number to compare with break-even. Demo Brand's break-even of 2.0 means the whole budget is profitable, even though neither platform's ROAS is the real answer.
Use platform ROAS to compare campaigns and ads inside one platform. Use MER to decide whether the total budget is working. Our guide to MER covers how to set an MER target and the new-customer version of it.
When is a low ROAS fine?
When the campaign is buying customers who will buy again, and you can prove they do.
Retargeting and branded search usually show high ROAS because they reach people who were already close to buying. Prospecting campaigns that find new customers usually show lower ROAS on the first order. Cut prospecting because its ROAS looks weak, and you also shrink the pool of new visitors that retargeting depends on.
The test is lifetime contribution, not first-order ROAS.
Demo Brand example: a first order brings $50 of contribution. Demo Brand's own order data shows the average new customer places 1.6 orders in 12 months, worth $80 of contribution in total. Demo Brand can pay up to $80 to acquire a customer and still break even over the year. On a $100 first order, that is a first-order break-even ROAS of 1.25, well below the 2.0 a single order needs.
Three conditions make that safe:
- The repeat rate comes from your own cohorts, measured over a full year, not a hoped-for number.
- You can fund the gap. The money comes back over months, so cash flow has to carry it.
- You measure new customers separately, so returning-customer revenue does not hide a prospecting campaign that is not working.
A low ROAS is also expected during creative tests and launches, when spend goes to learning what works. Set a budget and an end date for that spend before it starts.
When is a high ROAS a warning sign?
When it comes from spending too little. A brand running only retargeting at an 8.0 ROAS may be leaving growth on the table, because it is mostly reaching people who would have bought anyway. If ROAS is far above target and spend has been flat for months, test more budget on prospecting and watch MER, not platform ROAS.
Frequently asked questions
What is a good ROAS for ecommerce? Any ROAS above your break-even ROAS, which is 1 divided by your contribution margin. At a 50% contribution margin that is 2.0; at 25% it is 4.0.
Is a 2.0 ROAS good? It is break-even for a brand with a 50% contribution margin, profitable above that margin and a loss below it. Run your margin through the formula before judging it.
How do I calculate ROAS? Divide revenue from ads by ad spend. $5,000 in sales from $1,000 in spend is a 5.0 ROAS, or 500%.
What is the difference between ROAS and MER? ROAS uses the revenue an ad platform credits to itself. MER uses total Shopify revenue divided by total marketing spend, so it cannot be inflated by overlapping attribution.
Should I use gross margin or contribution margin for break-even ROAS? Contribution margin. Gross margin leaves out shipping, payment fees and discounts, which makes break-even ROAS look lower than it really is.

Michael Bui founded and runs BLOOM10X, a growth agency for ecommerce brands on Shopify. About BLOOM10X