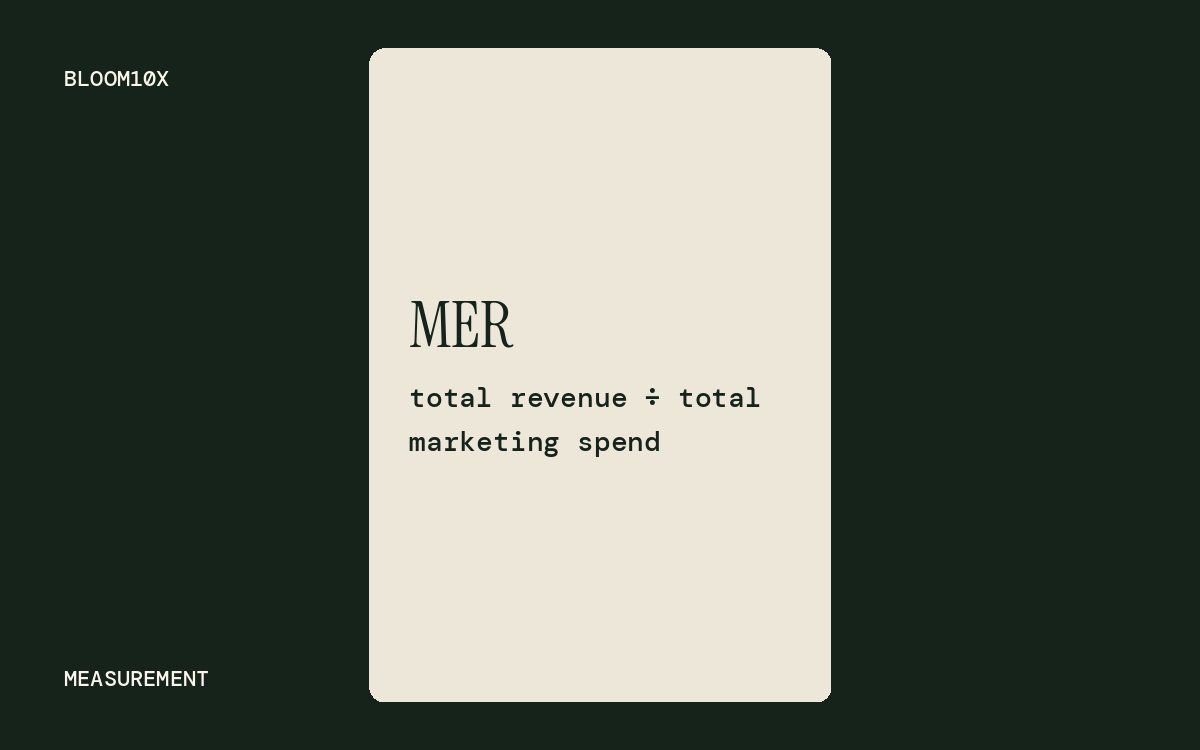
- MER is total store revenue divided by total marketing spend across every channel, so no platform can inflate it.
- ROAS tells you how one platform claims it performed; MER tells you whether the whole marketing budget paid off.
- Set your target MER from contribution margin, where break-even MER is 1 divided by your contribution margin before marketing.
MER (marketing efficiency ratio) is your total store revenue divided by your total marketing spend, across every channel, for the same period. If you sold $600,000 last month and spent $150,000 on marketing, your MER is 4.0. This article covers the formula with a worked example, how MER differs from ROAS, why the platforms over-count, the new-customer version of MER, and how to set a target from your margins.
What is the MER formula?
MER = total revenue / total marketing spend
Both numbers come from outside the ad platforms. Revenue comes from Shopify. Spend is the sum of every ad invoice for the period.
Two decisions keep the number honest:
- Which revenue. Pick one Shopify sales figure, such as net sales after discounts and returns, and use it every month. Switching between gross and net makes MER jump for no real reason.
- Which spend. At minimum, add up all paid media: Meta, Google, TikTok, Pinterest, affiliates, influencer fees. Some brands also include agency fees and creative costs. Either is fine, as long as the definition stays the same all year.
Worked example: Demo Brand
Demo Brand is a made-up Shopify store with round numbers, used here as an example.
| October | |
|---|---|
| Shopify net sales (all channels) | $600,000 |
| Meta ad spend | $90,000 |
| Google ad spend | $45,000 |
| TikTok ad spend | $15,000 |
| Total marketing spend | $150,000 |
| MER | $600,000 / $150,000 = 4.0 |
For every $1 Demo Brand spent on marketing in October, the store took in $4 in sales. That $600,000 includes everything: paid traffic, organic search, email, repeat customers, word of mouth. MER does not try to split it up. It asks one question: did the total spend produce enough total revenue?
MER vs ROAS: what is the difference?
ROAS (return on ad spend) is revenue attributed to an ad platform divided by spend on that platform. MER uses all revenue and all spend.
| MER | ROAS | |
|---|---|---|
| Revenue used | All store revenue (Shopify) | Revenue the platform credits to its own ads |
| Spend used | All marketing spend | Spend on one platform, campaign or ad |
| Who reports it | You, from your own data | Meta, Google, TikTok, each in its own dashboard |
| Can it double-count? | No | Yes, across platforms |
| Best for | Judging the whole marketing budget | Choosing between campaigns, ads and audiences inside one platform |
| Weakness | Does not say which channel worked | Each platform grades its own homework |
You need both. ROAS steers decisions inside a platform. MER tells you if the business is getting paid for the total spend. For more on reading platform ROAS, see what is a good ROAS.
Why do ad platforms over-count sales?
Each platform counts a sale as its own if the buyer touched one of its ads inside its attribution window. They do not check with each other.
Meta's standard attribution setting counts a purchase that happens within 1 or 7 days after a link click, or within 1 day after someone saw the ad, according to the Meta Business Help Center (2026). Google Ads uses data-driven attribution as the default for most conversion actions, which gives its own ads a share of each conversion based on the clicks and interactions it can see (Google Ads Help, 2026). Klaviyo's default windows credit an order to an email if it comes within 5 days of an open or a click (Klaviyo Help Center, 2026).
So one customer who sees a Meta video, searches the brand name on Google, opens an email and buys can show up as a sale in all three dashboards.
Here is Demo Brand's October again, using what each platform reported:
| Source | Revenue it claims |
|---|---|
| Meta | $360,000 (ROAS 4.0) |
| $225,000 (ROAS 5.0) | |
| TikTok | $45,000 (ROAS 3.0) |
| Klaviyo email and SMS | $150,000 |
| Total claimed | $780,000 |
| Shopify actual | $600,000 |
The dashboards claim $180,000 more than the store sold. Every platform number above can be "correct" by its own rules. That is why the number you run the business on has to come from Shopify.
What is new-customer MER (aMER)?
Blended MER has a blind spot: repeat customers. A brand with a loyal base can post a strong MER while its ads find almost no new buyers. Returning customers keep revenue up for a while, then the base shrinks.
New-customer MER, often called aMER (acquisition MER), fixes that:
aMER = revenue from first-time customers / total marketing spend
Shopify's New vs returning customers report splits sales between first-time and returning buyers, so you can pull this without extra software.
For Demo Brand, $240,000 of October's $600,000 came from first-time customers.
aMER = $240,000 / $150,000 = 1.6
Read the two numbers together:
- MER up, aMER flat or down: growth is coming from existing customers. Acquisition may be stalling.
- MER flat, aMER up: ads are bringing in more new buyers. Expect repeat revenue to follow.
- Both down: spend is rising faster than results. Check creative fatigue and offer first.
How do you set a target MER?
Start from contribution margin, not from a number you heard on a podcast. Contribution margin before marketing is what is left from each sale after the costs that come with it: product cost, shipping and fulfillment, payment fees, and discounts if you track them as a cost.
Break-even MER = 1 / contribution margin before marketing
Demo Brand's average order, as an example:
| Per order | Amount |
|---|---|
| Net revenue | $100 |
| Product cost (COGS) | $35 |
| Shipping and fulfillment | $12 |
| Payment processing | $3 |
| Contribution before marketing | $50 (50%) |
Break-even MER = 1 / 0.50 = 2.0. At an MER of 2.0, marketing eats the whole contribution and nothing is left for fixed costs or profit.
To keep a set share of revenue after marketing, subtract it first:
Target MER = 1 / (contribution margin before marketing minus target margin after marketing)
If Demo Brand wants 15% of revenue left after marketing: 1 / (0.50 - 0.15) = 2.86.
Check it on October's numbers. $600,000 in sales leaves $300,000 of contribution. At an MER of 2.86, spend would be about $210,000, leaving $90,000, which is 15% of sales. At the actual MER of 4.0, spend was $150,000 and $150,000 was left, or 25%.
So Demo Brand's floor is 2.0, its target is about 2.9, and it has room to spend more while MER stays above that line. The ROAS calculator runs the same math: enter your margins and it shows break-even ROAS and MER.
Setting an aMER target
aMER can sit below break-even if new customers come back. If Demo Brand's customers bring in another $50 of contribution over the next 12 months on top of the first order, it can afford to spend more to win each one. Use your own cohort data from Shopify's Customer cohort analysis report to set this, and be conservative until you have at least a year of history.
What are the limits of MER?
MER is a scoreboard. It does not tell you which play scored.
- It does not say which channel works. If MER drops, it could be Meta, Google, a weak email month or a price change. You still need platform data and tests to find out.
- Non-marketing events move it. A product launch, a stock-out, a wholesale order counted in Shopify or a press mention can shift MER without any change in ad performance.
- It lags. Spend that builds awareness this month can show up as sales next month. Read MER over 4-week or monthly periods, not daily.
- It can reward under-spending. Cutting spend almost always raises MER for a while, because returning customers keep buying. A higher MER on lower revenue is not always a win.
The fix is to pair MER with tests that measure lift. Meta offers incremental attribution, which optimizes and reports on conversions its model predicts were caused by the ad. Geo or holdout tests, where you turn spend off in some regions and compare, answer the channel question more directly.
MER earns its place because it measures what the founder cares about. Wholesale Fashion Trends grew store sales 45%, from $1.47M to $2.14M (Shopify, all channels, Jun 1 to Sep 27, 2026 vs 2025), on 5% more ad spend. That is the case study in MER terms: store sales include every channel, and revenue grew far faster than spend.
Frequently asked questions
Is MER the same as blended ROAS? Yes, in practice. Both divide total revenue by total spend. "Blended ROAS" usually means total ad spend only, while MER sometimes includes agency and creative costs, so state your definition.
What is a good MER? Any MER above your break-even, which is 1 divided by your contribution margin before marketing. A brand with a 50% contribution margin breaks even at 2.0; a brand with a 30% margin needs 3.33.
Should MER include email and SMS costs? If you include tools and agency fees in spend, include your email platform cost too. If you only count paid media, leave it out. Pick one and keep it.
How often should I check MER? Weekly for direction, monthly for decisions. Daily MER swings with order timing and promotions and leads to bad calls.
Is aMER better than MER? They answer different questions. MER shows if total spend paid off this month; aMER shows if your ads are still finding new customers. Track both.

Michael Bui founded and runs BLOOM10X, a growth agency for ecommerce brands on Shopify. About BLOOM10X