- Ten KPIs cover a Shopify brand across acquisition, conversion, retention and profit, and contribution margin is the one the rest answer to.
- Read them in funnel order, because a drop in one stage usually explains the number below it.
- Take revenue and customer numbers from Shopify, not from the ad platforms, and judge every KPI against contribution margin.
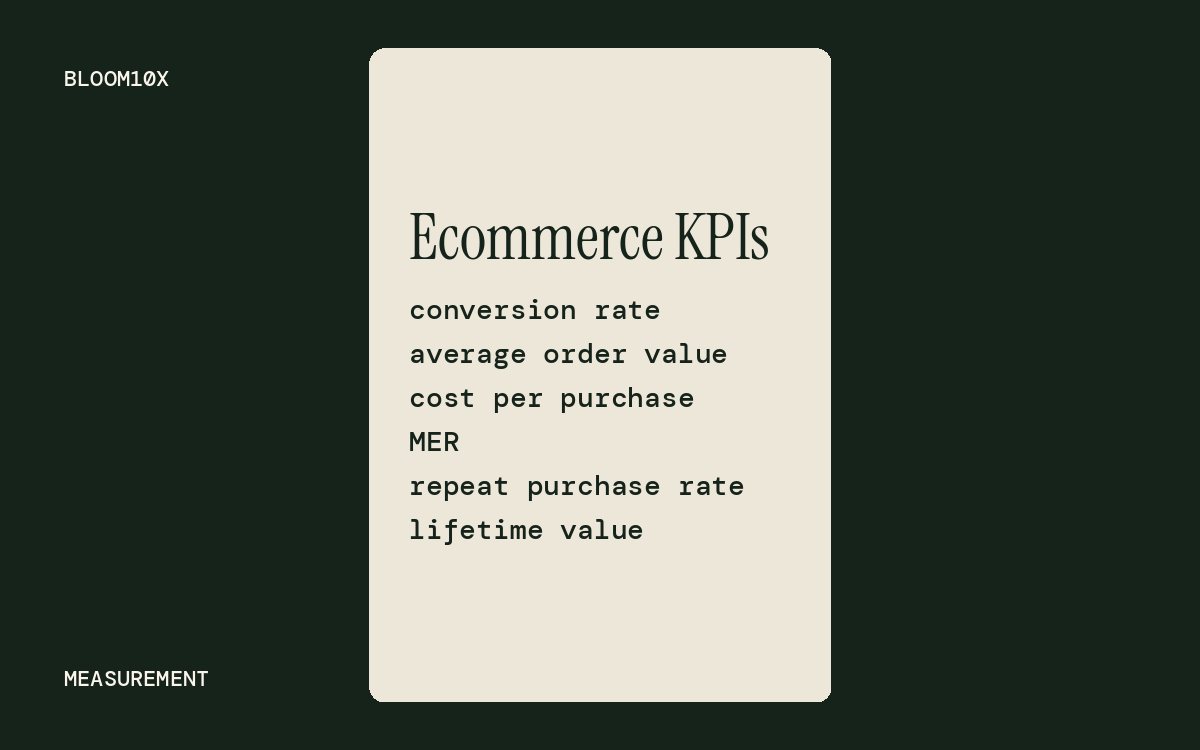
The ecommerce KPIs a Shopify founder should watch are the 10 that explain where revenue comes from and whether it is profitable: cost per purchase and CAC, MER, conversion rate, add-to-cart rate, checkout completion, average order value, repeat purchase rate, LTV, email/SMS revenue share, and contribution margin. This article groups them by funnel stage and gives the formula for each, where to find it in Shopify or the ad platform, and what actually moves it.
The 10 ecommerce KPIs at a glance
| Stage | KPI | Formula | Where to find it |
|---|---|---|---|
| Acquisition | Cost per purchase / CAC | Ad spend / purchases; total marketing spend / new customers | Ads Manager; Shopify + your spend sheet |
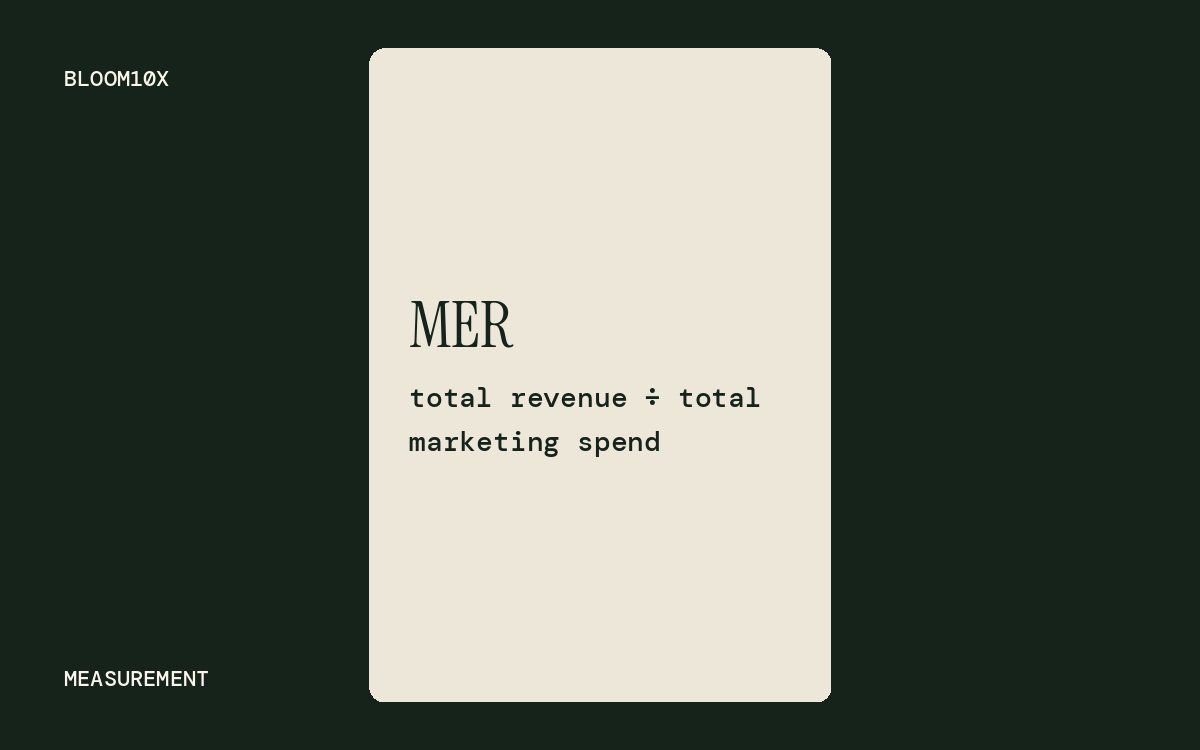
| Acquisition | MER | Total revenue / total marketing spend | Shopify sales + all ad invoices |
| Conversion | Conversion rate | Sessions that completed checkout / sessions | Shopify Analytics |
| Conversion | Add-to-cart rate | Sessions with cart additions / sessions | Shopify Analytics |
| Conversion | Checkout completion | Sessions that completed checkout / sessions that reached checkout | Shopify Analytics |
| Conversion | Average order value (AOV) | Revenue / orders | Shopify Analytics |
| Retention | Repeat purchase rate | Customers with 2+ orders / all customers | Shopify customer reports |
| Retention | LTV | Contribution per customer over 12 months | Shopify customer cohort analysis |
| Retention | Email/SMS revenue share | Email and SMS revenue / total revenue | Klaviyo + Shopify |
| Profit | Contribution margin | (Revenue minus variable costs minus marketing) / revenue | Shopify profit reports + your cost sheet |
To make the formulas concrete, the examples below use Demo Brand, a made-up Shopify store with round numbers. In one month it has 100,000 sessions, 2,000 orders, $200,000 in revenue and $50,000 in ad spend.
Acquisition KPIs: what does a customer cost?
1. Cost per purchase and CAC
Cost per purchase = ad spend / purchases the platform reports CAC = total marketing spend / new customers (from Shopify)
Cost per purchase lives in Ads Manager or Google Ads and is the number to manage campaigns on. CAC is the business number. It uses every dollar of marketing and only counts first-time buyers, which Shopify's New vs returning customers report gives you.
Demo Brand: $50,000 spend and 1,250 new customers = $40 CAC.
What moves it: creative is the biggest lever on cost per purchase, because it decides who stops and clicks. After that comes the offer, then landing page conversion rate. A page that converts twice as well halves the cost per purchase at the same CPM.
2. MER (marketing efficiency ratio)
MER = total store revenue / total marketing spend
Demo Brand: $200,000 / $50,000 = 4.0. MER is the one acquisition number no platform can inflate, because both inputs come from your own books. The full method, including new-customer MER and how to set a target from margin, is in what is MER.
What moves it: ad efficiency, but also anything that changes total revenue: a launch, a promotion, email volume, seasonality. Read it monthly.
Conversion KPIs: what happens on the site?
Shopify defines its funnel metrics per session. Conversion rate is sessions that completed checkout divided by sessions, and checkout conversion is sessions that completed checkout divided by sessions that reached checkout (Shopify ShopifyQL documentation, 2026). Use the same definitions so your numbers match the admin.
3. Conversion rate
Conversion rate = sessions that completed checkout / sessions
Demo Brand: 2,000 / 100,000 = 2.0%.
For a rough baseline, Shopify's ecommerce conversion rate guide (2026) cites Statista's figure that 1.4% of global ecommerce visits converted in Q1 2026, and Dynamic Yield's 2.66% average across more than 400 brands. The same guide warns these are a baseline, not a target. Category, price point and traffic mix move the number more than anything else, so compare against your own last 90 days first.
What moves it: traffic quality first. A jump in cold prospecting traffic lowers conversion rate even if the site is fine. Then product page clarity, reviews, delivery promise and price.
4. Add-to-cart rate
Add-to-cart rate = sessions with cart additions / sessions
Demo Brand: 8,000 / 100,000 = 8%.
This is the product page's score. If conversion rate falls and add-to-cart rate falls with it, the problem is upstream: the traffic, the page or the offer. If add-to-cart holds and conversion falls, look at cart and checkout.
What moves it: above-the-fold product images, a clear price and delivery date, size or variant guidance, reviews near the button.
5. Checkout completion rate
Checkout completion = sessions that completed checkout / sessions that reached checkout
Demo Brand: 2,000 / 4,000 = 50%.
Leaks are normal here, but they are fixable. Baymard Institute's cart abandonment research puts the average documented cart abandonment rate at 70.22%, across 50 studies (updated 2026). Among shoppers who abandoned for reasons other than browsing, 40% blamed extra costs such as shipping, taxes and fees.
What moves it: showing shipping costs before checkout, guest checkout, accelerated payment options like Shop Pay, and fewer form fields. The funnel leak checklist walks through each step.
6. Average order value (AOV)
AOV = revenue / orders
Demo Brand: $200,000 / 2,000 = $100.
AOV matters because most costs per order (shipping, picking, payment fees, and the ad that brought the buyer) do not double when the basket doubles. A higher AOV lets you pay more to acquire a customer at the same margin.
What moves it: bundles, free-shipping thresholds set just above current AOV, volume pricing and post-purchase offers. More tactics are in how to increase average order value.
Retention KPIs: do customers come back?
7. Repeat purchase rate
Repeat purchase rate = customers with 2 or more orders / all customers in the period
Shopify's Returning customers report lists customers with two or more orders, and Shopify counts a returning customer as one whose order history already includes at least one order (Shopify Help Center). Fix a window and keep it, for example customers acquired in a quarter and whether they bought again within 12 months.
Demo Brand example: of 3,000 customers acquired in Q1, 840 ordered again within 12 months = 28%.
What moves it: product quality and replenishment cycle first, then post-purchase email and SMS flows, a reason to come back (new drops, refills, loyalty perks) and fast, easy returns or exchanges.
8. Customer lifetime value (LTV)
LTV = contribution margin per customer over a set period (12 months is a good default)
Use contribution, not revenue. A customer who spends $300 on products with thin margins is worth less than one who spends $200 on products with fat ones. Shopify's Customer cohort analysis report groups customers by first-order month so you can see how much each group spends over time.
Demo Brand: $50 contribution on the first order plus $25 from repeat orders in 12 months = $75 LTV. Against a $40 CAC, that is an LTV to CAC ratio of about 1.9.
What moves it: repeat purchase rate, AOV on repeat orders and margin on the products returning customers buy.
9. Email and SMS revenue share
Email/SMS revenue share = revenue attributed to email and SMS / total store revenue
Demo Brand: Klaviyo attributes $40,000 of $200,000 = 20%.
Treat this as a trend, not a precise number. Klaviyo's default attribution windows credit an order to an email if it comes within 5 days of an open or a click (Klaviyo Help Center, 2026), so it overlaps with sales the ad platforms also claim. A share that falls month after month usually means flows are broken, the list is not growing, or sends have slowed.
What moves it: list growth from site sign-up forms, the core flows (welcome, abandoned cart, browse abandonment, post-purchase, winback) and a steady campaign calendar.
Profit KPI: is the growth worth it?
10. Contribution margin
Contribution margin = (net revenue minus COGS, shipping and fulfillment, payment fees and marketing spend) / net revenue
This is the KPI every other one answers to. Revenue can rise while contribution falls if growth is bought with discounts and expensive ads.
Demo Brand, per month:
| Amount | |
|---|---|
| Net revenue | $200,000 |
| COGS (35%) | $70,000 |
| Shipping and fulfillment (12%) | $24,000 |
| Payment fees (3%) | $6,000 |
| Contribution before marketing | $100,000 (50%) |
| Marketing spend | $50,000 |
| Contribution after marketing | $50,000 (25%) |
Shopify's profit reports use the product costs you enter for each item. Shipping, fees and ad spend usually need a simple sheet alongside. The ROAS calculator turns contribution margin into break-even ROAS and MER, which gives every acquisition KPI above a line to beat.
What moves it: product cost and pricing, discount depth, shipping rates and how much of revenue goes to marketing.
How should you review these KPIs?
Read them top to bottom, in funnel order. A change at one stage usually explains the change below it.
- Weekly: cost per purchase, conversion rate, add-to-cart rate, checkout completion. These move fast and point to a fix you can make this week.
- Monthly: MER, CAC, AOV, email/SMS revenue share, contribution margin.
- Quarterly: repeat purchase rate and LTV by cohort. They need time to show a change.
Take every revenue and customer count from Shopify. Use ad platform numbers only to compare campaigns inside that platform.
Frequently asked questions
What is the most important ecommerce KPI? Contribution margin after marketing. Every other KPI matters because of how it changes the profit left from each sale.
What is the difference between ecommerce KPIs and ecommerce metrics? A metric is anything you can measure, like page views. A KPI is a metric you have chosen to manage the business on, with a target attached.
What is a good ecommerce conversion rate? Shopify's 2026 guide cites 1.4% (Statista, Q1 2026) and 2.66% (Dynamic Yield) as global averages. Your category, price and traffic mix matter more, so set targets from your own trend.
How do you calculate repeat purchase rate? Divide the number of customers with two or more orders by all customers in the same period. Use a fixed window, such as 12 months from first order, so the number compares cleanly over time.
Should I track CAC or cost per purchase? Both. Cost per purchase manages campaigns inside an ad platform; CAC, from Shopify's new customer count and all marketing spend, tells you what a new customer really costs.

Michael Bui founded and runs BLOOM10X, a growth agency for ecommerce brands on Shopify. About BLOOM10X